At the end of 2022, I got a solar system installed on my home. Outside of feeling good that we’re doing our little bit to help the environment (and save ourselves some money at the same time), I was excited to dive into the numbers
- How much electricity I was generating?
- How much I was using? What is using it?
- How much do I give back to the grid?
My solar system is an Enphase, it has a nice app for looking at my numbers, but happily it also has a pretty solid API that I can use to pull down my data. I wrote a little Python script that pulls down my system’s data in 15 minute increments (generation, usage and net flow into or out of the grid), and ran this to collect data for the whole of 2023.
When We Generate Electricity
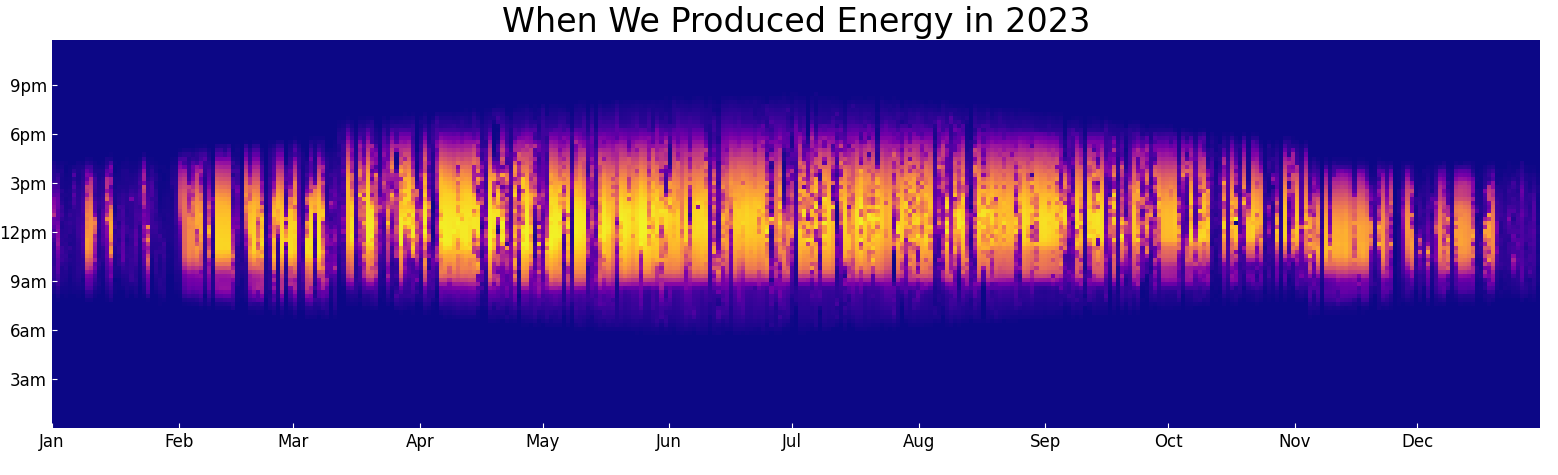
Each pixel here is an individual 15 minute increment. The color of the pixel represents the amount of electricity generated in that 15 minute period. The x-axis is the day of the year, and the y-axis is the time of day.
Rather obviously, the system generates most electricity in the middle of the day, and in summer and the dark vertical stripes correspond to very cloudy or snowy days. One thing I liked about this plot is that it’s very easy to see the days getting longer and shorter as the year progresses, and the little jumps in spring and fall when we change the clocks.
When we Use Electricity
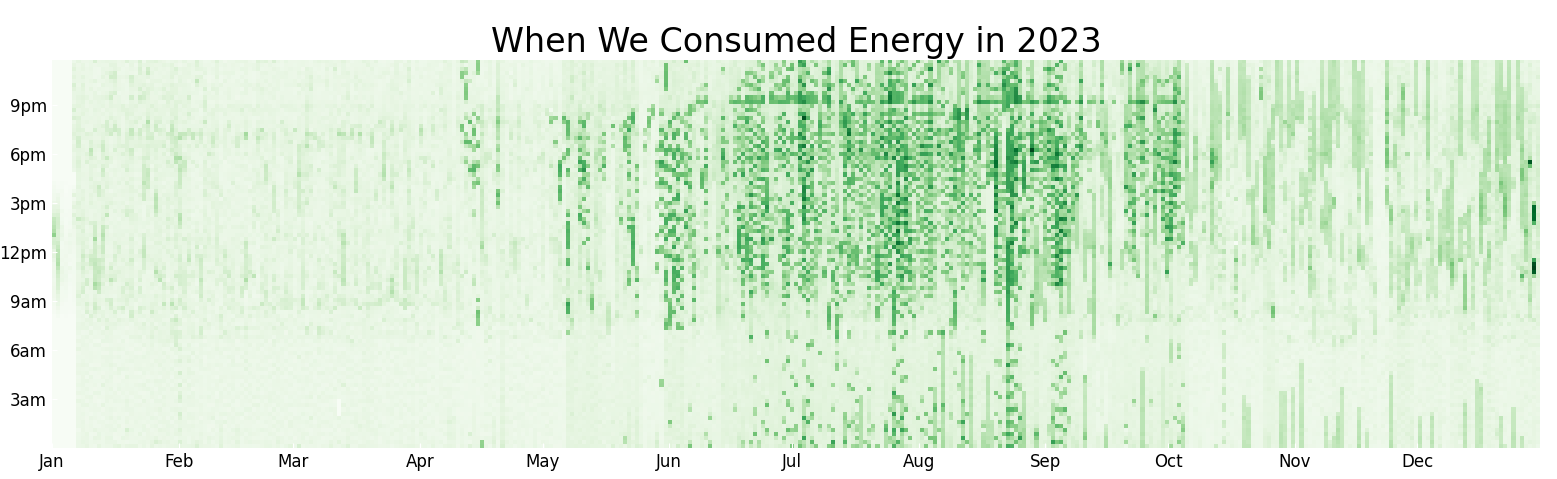
This heatmap is similar to the one above, but is now showing when we use electricity. The color of the pixel represents the amount of electricity used in that 15 minute period.
The things that stand out to me on this chart are:
- Our biggest electricity hog by far is the AC, we see lots of vertical dark stripes throughout the summer as the AC kicks on and off.
- In August we purchased an electric car, and you can see the car charging in the evenings. We initially charged it on a Level 1 charger, so you see long vertical stripes throughout the evening as it charged overnight.
- Towards the end of the year, we started charging the car on a Level 2 charger, and you can see the charging time drop off significantly (the few dark spots all the way on the right)
Net Electricity Usage
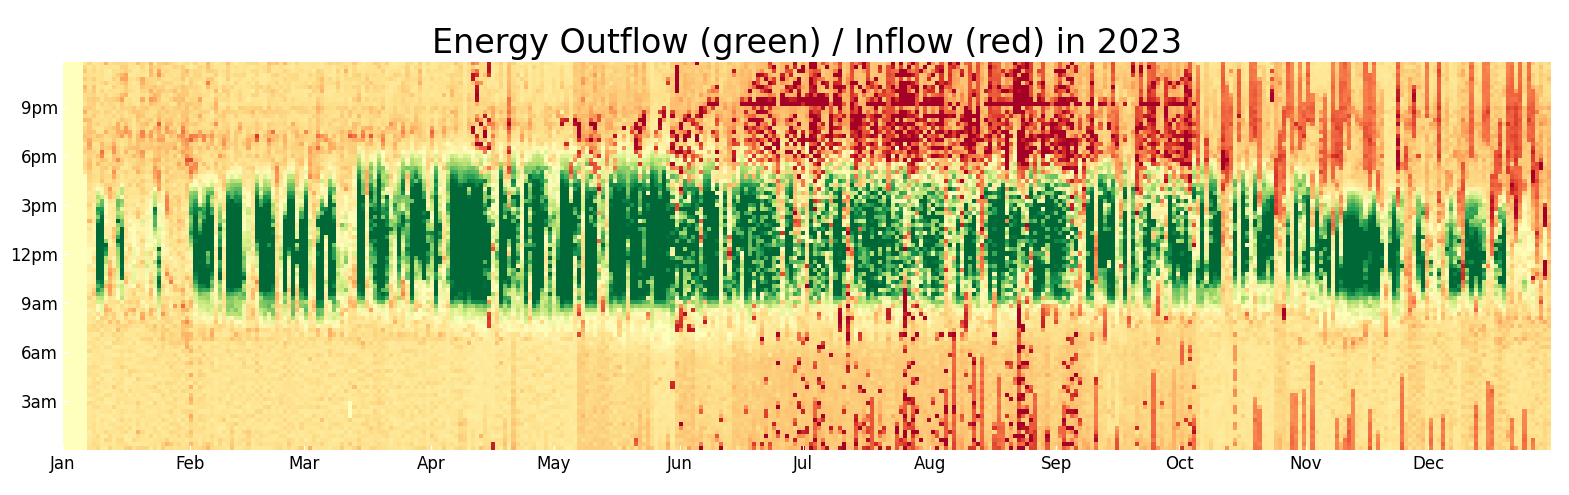
Same as above, but now showing when we sent electricity to the grid, or consumed it. Throughout the year we had produced slightly less than we used, and our two largest consumers of electricity were the AC and car.
Next Steps
This exercise taught me a lot about our electricity use, and informed what I plan to do to the house during 2024. Over time, we plan to fully electrify the house, which means replacing the remaining gas applicances (oven, water heater, dryer, furnace) with electric ones, so our electricity usage is only going to go up.
We already use slightly more than we generate, so I’m going to have to think about increasing our home’s efficiency, likely with a home energy audit. I don’t really have the appetite to install more solar panels right now!
Header photo courtesy of Anders J on Unsplash.